Introduction #
Social media platforms are revolutionizing how we interact, collaborate, consume, and create new content1. Furthermore, the rapid dissemination of the Internet and related services, especially social networks and user-generated content, led to incredible amounts of digital information, better known as big data.
Analysis of vast amounts of data requires special tools and methods. As a result, industry managers and researchers increasingly embrace technological innovations that make decision-making effective in the context of big data. In the past, many decisions were made based on gut feeling alone, but this approach has its limitations. For example, it is often difficult to accurately quantify and measure the factors contributing to a person’s gut feeling, making it difficult to justify or defend a decision. Additionally, relying on gut feeling alone can lead to bias and subjectivity, ultimately leading to poor decision-making.
As an alternative, data analysis offers a more systematic and objective approach to decision-making2:
By collecting and analyzing relevant data, it is possible to identify trends, patterns, and relationships that may not be immediately apparent through gut feeling alone. This information can then be used to inform and support decision-making, providing a more solid foundation for the decisions that are made.
Furthermore, data analysis allows for the integration of multiple sources of information, providing a more comprehensive view of a situation. This can help reduce the potential for bias and subjectivity and provide a more nuanced understanding of the factors at play.
This can ultimately lead to more accurate and effective decision-making. In research, you often start with theory and validate it with an empirical analysis. However, in some contexts you may not have a theory or cannot apply it. In such settings, it makes sense, to follow an empirics-first approach guided by expert-knowlege3. It is important to emphasize that data must always be analyzed with care. Wrong assumptions, methods, or interpretations can be worse than gut feeling4. Therefore, a compromise between intuition and information is often desirable5.
Data: The New Oil of the Digital Economy6
#
Data plays a crucial role in marketing research and practice. In marketing research, we use data to test hypotheses and theories about consumer behavior and to gain new insights into the effectiveness of marketing campaigns. In practice, companies exploit data to inform marketing strategy and to guide the development of targeted marketing campaigns. For example, data helps to understand consumer preferences, identify potential customers, track the effectiveness of marketing efforts and optimize their impact, and develop new products and services that align with consumer needs and preferences. In short, data is a critical tool for advancing knowledge and making informed decisions in marketing.
Data does not always have to be the starting point of analysis. Different perspectives can be used to conduct empirical research. Two viable options are the data-driven and the theory (hypothesis) driven perspectives. These two methods of doing research have developed somewhat independently.
The different perspectives have to be explained in detail to understand the differences. On the one hand, hypothesis-driven research seeks to address a specific, measurable and answerable question. Moreover, a well-constructed hypothesis has several characteristics, e.g., clear, testable, and allows acceptance or rejection. On the other hand, data-driven research is an exploratory approach that analyses data to extract scientifically exciting insights.
Data-driven research is frequently applied in natural sciences. In contrast, theory-driven research has dominated social and organizational sciences and focuses on identifying abstract contracts and their relationships7. An exclusive research approach dealing with only one of the methods can be problematic. Focusing on data-driven research can lead to identifying trends and patterns that answer the set questions. However, it might not provide sufficient scientific knowledge. In contrast, pursuing a theory-driven approach might result in missed discoveries. However, therefore it provides a scientifically highly reliable analysis of the provided constructs. Based on the role of data, we can distinguish between data-driven, data-informed, and data-inspired analysis.
From a forward-looking perspective, the significance of hypothesis-driven models is descending. We live in a world where massive amounts of data and applied mathematics replace every other tool. Peter Norvig, Google’s research director, added an update to George Box’s maxim “all models are wrong” – “and increasingly you can succeed without them.” Scientists often don’t know why things are happening, but they do happen. And that’s the point. We can raise a high amount of data and analyze it with state-of-the-art technology. And with enough data, the numbers speak for themselves, so there are only a few cases where hypothesis models are needed in the way they were used before8.
**In-class task** Read the article [The End of Theory: The Data Deluge Makes the Scientific Method Obsolete.](https://www.wired.com/2008/06/pb-theory/) by Anderson C. Based on this, we will discuss the following questions in class: - What is the difference between causation and correlation? - When can correlation be helpful? - What is the role of theory these days? Link: **[https://www.wired.com/2008/06/pb-theory](https://www.wired.com/2008/06/pb-theory)**
It is common to use the shape to describe data. For example, many variables (i.e., columns) characterize fat data. In this vein, we can distinguish between short and tall data. We call it short (tall) when we have few (many) observations (i.e., rows).
Data Sources #
That data analysis is helpful in many cases. Very soon, however, the questions arise: Where do we get the data from? There are many different sources of data that can be used for analysis. Some common sources include:
- Government agencies and organizations, which often collect and publish data on various topics such as population, economic indicators, and health statistics.
- Commercial data providers, which offer data sets for purchase or licensing on a wide range of topics.
- Research organizations and institutions, which collect and publish data as part of their research activities.
- Sensor networks and other Internet of Things (IoT) devices, which can generate data on a wide range of physical phenomena.
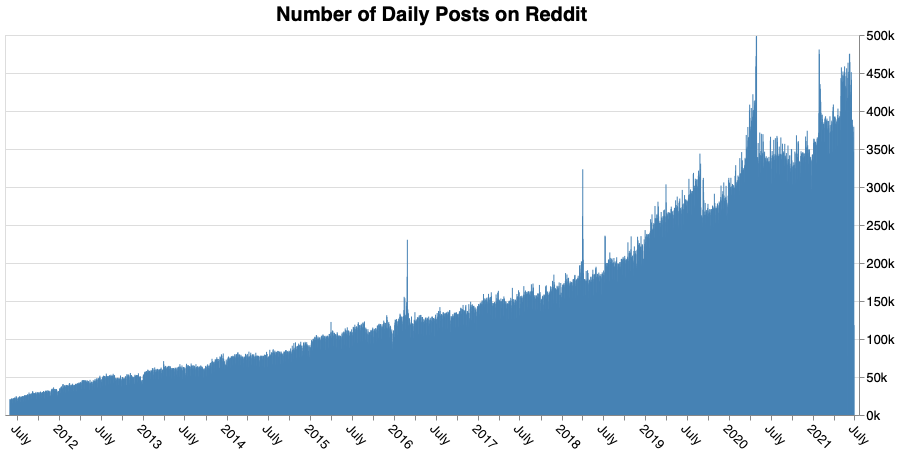
- Social media platforms, which generate large amounts of data through the activities of their users.
Ultimately, the data sources used for a given analysis will depend on the questions being asked and the type of data needed to answer them.
Marketing scholars often use web scraping and APIs to collect data from the internet. However, the challenges in doing so have received little attention. Marketing scholars proposed a framework to ensure the validity of data sets generated via web scraping and APIs9. It addresses technical and legal/ethical concerns during the selection of data sources, collection design, and data extraction. The authors also review articles using web data published in top marketing journals and offer a typology of how web data has advanced marketing thought.
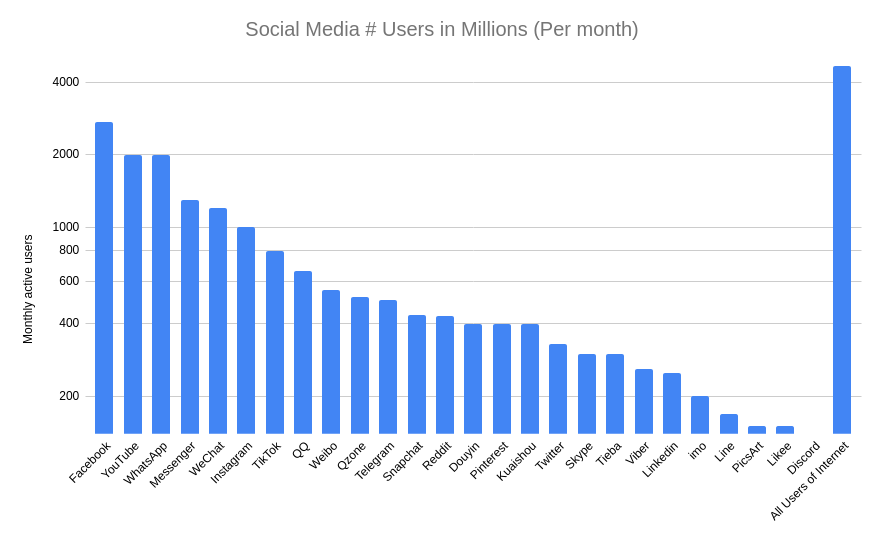
Social media platforms have become the most prominent data generator since the early 2000s. Approximately 4.59 billion Internet users worldwide used social media in 202210. According to the GDPR, generated data is primarily personal and therefore belongs to the user, who makes it public and, therefore, freely accessible after agreeing to the terms of use after registration. Sensitive data, for example, may only be challenged by the competent authorities in exceptional cases, e.g., criminal prosecution.
Marketing scholars often use web scraping or APIs to collect data from the internet. Scraping publicly accessible data is legal, according to a U.S. appeals court ruling11.
| Platform | Web UI | API | Data dump |
|---|---|---|---|
| ✓† | ✓ | - | |
| ✓‡ | ✓ | - | |
| ✓ | ✓ | ✓⁎ | |
| Wikipedia | ✓ | ✓ | ✓ |
| Musicbrainz | ✓ | ✓ | ✓ |
| ⁎provided by third-party †highly restricted ‡liberal licence available | |||
**In-class task:**Twitter offers an advanced search function. Here you can not only search for keywords, but also specify phrases, define [OR/AND relationships](https://developer.twitter.com/en/docs/twitter-api/tweets/search/integrate/build-a-query#boolean) and even filter by [country, language or media content](https://developer.twitter.com/en/docs/twitter-api/tweets/search/integrate/build-a-query#list). These queries can be used not only with the online interface, but also with the API, and are therefore essential for data collection on Twitter. Use the next few minutes to write a query in which matches all YouTube videos shared on Twitter in December, 2022. Moreover, the Tweets should be in German, or posted in Germany. In computer science there is the "[divide and conquer](https://en.wikipedia.org/wiki/Divide-and-conquer_algorithm)" approach, where complex tasks are broken down into a number of smaller, easier tasks. With this in mind, we can build and test the query step by step: 1. Write a base query that matches YouTube videos shared on Twitter. To do this, take an exploratory look at both YouTube and Twitter to see what the [URL](https://en.wikipedia.org/wiki/URL) of YouTube videos look like. Are there possibly multiple possibilities? Please test your query via Twitter online search. 2. Update the query such that it only matches Tweets posted in December 2022. 3. Extend your query by selecting only Tweets written in german. 4. Finally, weaken you country-filter by also selecting those Tweets written in Germany.
Big data #
Big data refers to processing large, complex, rapidly changing data volumes or weakly structured data that cannot be evaluated with manual and conventional data processing methods2 12. Companies see exploiting big data as a way to improve operational efficiency, develop new revenue streams, and gain a competitive advantage over rivals13.
Especially recent developments in machine learning, such as deep learning, enables us to analyze soaring amounts of data12 14. Big data allows us to shed light on variation across subpopulations, construct consistent long-run statistical indices, generate new quasi-experimental research designs, and track diverse outcomes from natural and controlled experiments15. However, to profit from conducting data-driven research, we have to ensure that we do not fall for the “Hype of Data Science”16. There can also be a need for hypothesis-driven approaches in fields like marketing. Furthermore, Data science has to be taught from the bottom to help data scientists start their careers with a well-founded knowledge of the interface between Statistics and Computer Science4.
Big data is often characterized by 3-5 Vs depending on the source2. The most common ones are Volume, Velocity, Variety, and Veracity.
From a technical point of view, big data refers to hardware, software, and methods that can be used to process and analyze large amounts of unstructured data. These include Online Analytical Processing, non-rational database concepts for processing large and unstructured data sets (NoSQL), real-time analysis of data streams, and others. All of the technologies and approaches enable the efficient use of big data.
In social media, marketers utilize big data to get crucial observations into the users’ lives and then frame efficient marketing strategies. Marketers extract the essential parts of the big data, which help them target the potential customers easier by drawing out a specific demographic, a particular lifestyle, different behavioral patterns, or general dislikes. Before the information received can be evaluated, it is often transformed into a structured form. The input and results of an analysis are commonly stored in central data warehouses or so-called data lakes to be evaluated as other data by the business intelligence teams.
Volume: The more the better? #
There is a massive volume of information that can’t be handled by the traditional data-processing application software2.
Velocity: Ever faster ever further! #
Velocity refers to the speed with which the data sets are generated and transferred. Information in versatile correspondence systems and streaming video data are some examples.
Analysis, inference, or evaluation occurs in real time 2. With the knowledge of the user’s needs, the chance of losses from investing money in the wrong products might be decreased. Based on big data, marketers can create personalized campaigns which approach the users within the right segments and turn them into customers. Furthermore, big data allows tracking campaigns and deriving different statistics, which help optimize marketing strategies.
Variety: Structure #
The contents of big data are incredibly diverse. In contrast to conventional data analysis, which relies on structured information, big data is unordered and unorganized. For instance, map and image data have to be structured and managed.
To understand the different shades and shapes of data, we must first differentiate regarding the content, specifically, its structure2. Structured data is also known as quantitative data. We can organize structured data efficiently in a table (such as an Excel worksheet or a relational database). Examples of structured data include balance sheets or addresses.
On the other hand, unstructured data is typically free-form and unorganized and may include text, images, audio, and video, among other formats17. Therefore, unstructured data makes applying traditional data analysis techniques difficult, which often require data to be structured in a specific way to be processed and analyzed. To analyze this data, it is necessary to use specialized techniques and tools designed to analyze unstructured data. These may include natural language processing algorithms, image and video analysis tools, and other approaches that are specifically designed to extract insights from unstructured data. Therefore, unstructured data is challenging to organize in tables. However, in some settings, it is possible to transform the unstructured data into a structured form, allowing the application of more traditional methods18.
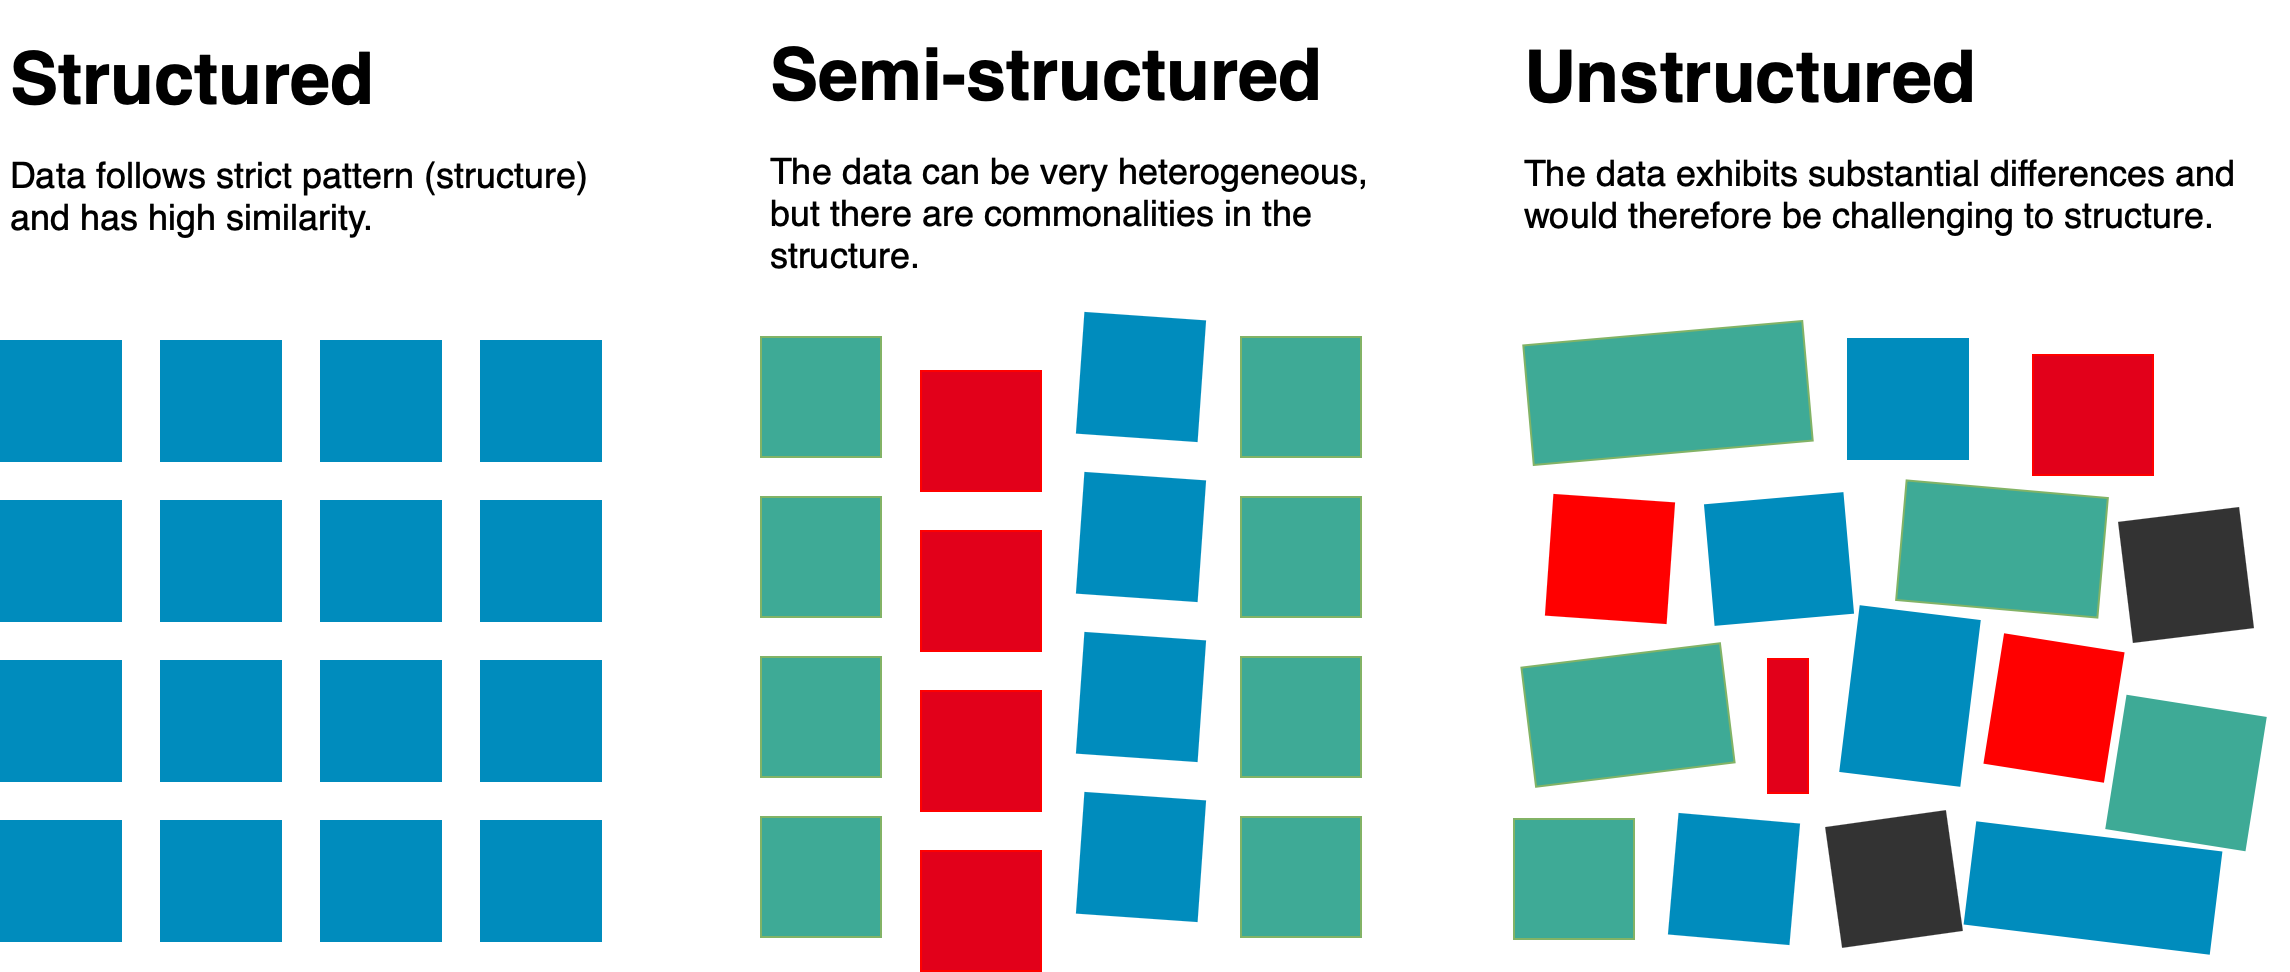
There is a tradeoff between structure: more structure is easier to store and analyze, but less structure offers more freedom for analysts. Semi-structured data is a mixture of both. A classic example of semi-structured data is websites (i.e., HTML source code).
Validity, veracity, and biases #
Not every piece of information is correct. The same applies to files and their contents. Data can be subject to biases, fraud, or simple mistakes.
Challenges #
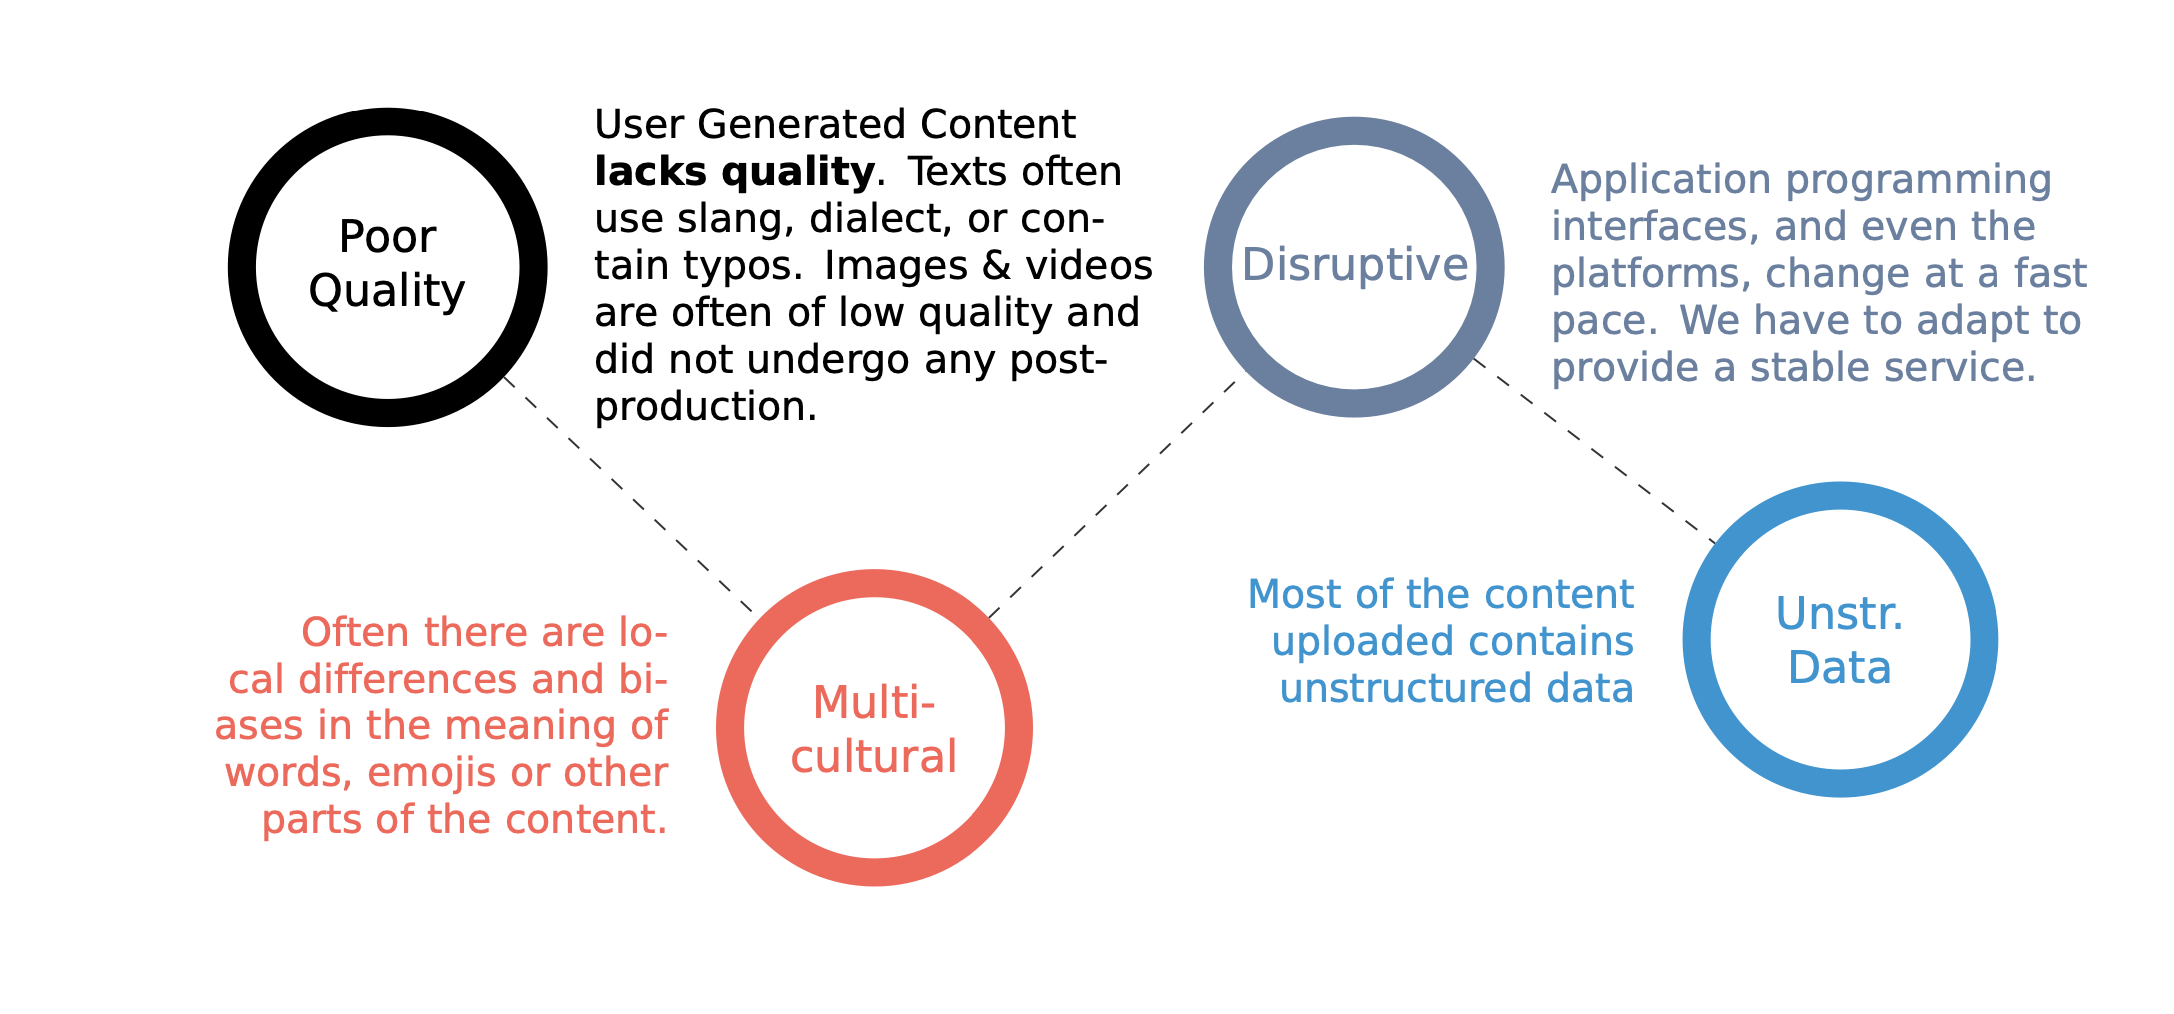
Most content on social media platforms is created by ordinary users and is therefore called user-generated content. Such content is challenging to analyze.
Data quality #
One of the significant issues with user-generated content is the potential for errors, such as typos, to be included in the shared information. Because user-generated content is not typically subject to the same level of review and editing as professionally produced content, there is a higher likelihood of errors. These errors can range from minor typos and spelling mistakes to more severe inaccuracies, such as incorrect facts or data. This can lead to dissemination of false or misleading information, which can have serious consequences. Therefore, it is essential for users to be vigilant about the quality of the content they are sharing and to fact-check information before sharing it with others. Additionally, social media platforms and other websites that host user-generated content should consider implementing systems to help identify and flag potential errors to improve the overall quality of the data on their platforms.
Multicultural dimension #
Social media has a strong multicultural dimension, allowing users from diverse backgrounds and cultures to connect and share information. This can be a valuable tool for promoting understanding and collaboration between different groups, as it allows individuals to learn about and engage with other cultures. However, it can also create challenges, as different cultural groups may have different norms and expectations regarding communication and information sharing. This can lead to misunderstandings and conflicts, mainly when users are unfamiliar with the cultural context of the content they are viewing or interacting with. To overcome these challenges, it is essential for social media users to be open-minded and respectful of the cultural differences of others and to strive to communicate in a way that is inclusive and respectful of all cultural groups. Additionally, social media platforms can play a role in promoting multiculturalism by providing tools and resources that help users to better understand and navigate the diverse cultural landscape of the platform.
Disruption #
User interfaces are constantly evolving, or how users interact with websites and online platforms. This can make it difficult for scrapers and other automated approaches to extract information from these platforms, as the structure and formatting of the data may change over time. As a result, scrapers and other computerized tools may become outdated and no more extend function as intended. This can be a significant challenge for businesses and organizations that rely on these tools to collect and analyze data from social media and other online platforms. To overcome this challenge, it is essential for developers to regularly update and maintain their scrapers and other automated tools to ensure that they continue to function appropriately and extract accurate and up-to-date data. Additionally, businesses and organizations that use these tools should be prepared to adapt to user interface changes and invest in developing new tools and approaches as needed.
Unstructured data #
Most user-generated content is unstructured (e.g., text, videos, and images). One of the major challenges of analyzing unstructured data is that it is not organized in a pre-defined manner, making it difficult to extract meaning and insights from the data. Additionally, it is essential to have a team of experienced data analysts who are familiar with these techniques and can work together to identify patterns and trends in the data.
## Too much theory? Don't worry, there is also an applied part. In social media analysis, we also want to analyze something. Especially when you have to handle more extensive data sets, it's hard to do without the appropriate toolset. Whereas in the past, Data Science relied primarily on programming languages such as [Python](https://en.wikipedia.org/wiki/Python_(programming_language)), [R](https://en.wikipedia.org/wiki/R_(programming_language)), or [Julia](https://en.wikipedia.org/wiki/Julia_(programming_language)), nowadays, [database management systems (DBMS)](https://en.wikipedia.org/wiki/Database#Database_management_system) are being used more and more frequently. They provide some significant benefits: - Most of them are incredibly scalable. - DBMS for [Online Analytical Processing](https://en.wikipedia.org/wiki/Online_analytical_processing) are built for data analysis and already support appropriate function support. - You don't have to learn Python, R, or Julia. DBMS understand the [Structured Query Language (SQL)](https://en.wikipedia.org/wiki/SQL). The advantage for newcomers is that it is a declarative and not imperative programming language. Consequently, you say what you want and not how you have to proceed. - The DBMS we use, [DuckDB](https://duckdb.org) shell, runs in your browser and does not require an installation. Since all the practical assignments require SQL, you should start as early as possible. The first unit will therefore have an introduction to the language as its focus right away. - [Slides: Introduction to SQL](https://slides.inkrement.ai/sql/intro) - [SQL Example Gist](https://gist.github.com/inkrement/c456079501dc2fa5821dc93aee02562a)
References & Further Reading #
Because of the importance of social media to various stakeholders, it has been the subject of significant research across many fields, including marketing and information systems19.
- Slides: Overview & Introduction
- Aral, S. (2021). The Hype Machine: How Social Media Disrupts Our Elections, Our Economy, and Our Health–and How We Must Adapt. Currency.
- Stephens-Davidowitz, Seth. Everybody lies: What the internet can tell us about who we really are. Bloomsbury Publishing, 2018.
- Agrawal, A., Gans, J., & Goldfarb, A. (2018). Prediction machines: the simple economics of artificial intelligence. Harvard Business Press.
Aral, S., Dellarocas, C., & Godes, D. (2013). Introduction to the special issue—social media and business transformation: a framework for research. Information systems research, 24(1), 3-13. ↩︎
Wedel, M., & Kannan, P. K. (2016). Marketing analytics for data-rich environments. Journal of Marketing, 80(6), 97-121. ↩︎ ↩︎ ↩︎ ↩︎ ↩︎ ↩︎
Golder, P. N., Dekimpe, M. G., An, J. T., van Heerde, H. J., Kim, D. S., & Alba, J. W. (2022). Learning from Data: An Empirics-First Approach to Relevant Knowledge Generation. Journal of Marketing. ↩︎
https://www.wired.com/story/machine-learning-reproducibility-crisis/ ↩︎ ↩︎
Frank, C. J., Magnone, P. F., & Netzer, O. (2022). Decisions Over Decimals: Striking the Balance between Intuition and Information. John Wiley & Sons. ↩︎
https://www.wired.com/insights/2014/07/data-new-oil-digital-economy/ ↩︎
Maass, W., Parsons, J., Purao, S., Storey, V. C., & Woo, C. (2018). Data-driven meets theory-driven research in the era of big data: Opportunities and challenges for information systems research. Journal of the Association for Information Systems, 19(12), 1. ↩︎
Boegershausen, J., Datta, H., Borah, A., & Stephen, A. (2022). Fields of gold: Scraping web data for marketing insights. Journal of Marketing. ↩︎
https://www.statista.com/statistics/278414/number-of-worldwide-social-network-users/ ↩︎
https://techcrunch.com/2022/04/18/web-scraping-legal-court/ ↩︎
Varian, H. R. (2014). Big data: New tricks for econometrics. Journal of Economic Perspectives, 28(2), 3-28. ↩︎ ↩︎
Sivarajah, U., Kamal, M. M., Irani, Z., & Weerakkody, V. (2017). Critical analysis of Big Data challenges and analytical methods. Journal of business research, 70, 263-286. ↩︎
Balaji, T. K., Annavarapu, C. S. R., & Bablani, A. (2021). Machine learning algorithms for social media analysis: A survey. Computer Science Review, 40, 100395. ↩︎
Einav, L., & Levin, J. (2014). Economics in the age of big data. Science, 346(6210), 1243089. ↩︎
https://www.washingtonpost.com/opinions/five-myths-about-big-data/2013/08/15/64a0dd0a-e044-11e2-963a-72d740e88c12_story.html ↩︎
Balducci, B., & Marinova, D. (2018). Unstructured data in marketing. Journal of the Academy of Marketing Science, 46(4), 557-590. ↩︎
Liu, X., Singh, P. V., & Srinivasan, K. (2016). A structured analysis of unstructured big data by leveraging cloud computing. Marketing Science, 35(3), 363-388. ↩︎
Kapoor, K. K., Tamilmani, K., Rana, N. P., Patil, P., Dwivedi, Y. K., & Nerur, S. (2018). Advances in social media research: Past, present and future. Information Systems Frontiers, 20(3), 531-558. ↩︎